A practice can look busy and still be losing money. Full waiting rooms, a packed schedule, and a growing patient roster tell you almost nothing about whether claims are getting paid, how long cash sits in accounts receivable, or whether a denial trend is about to eat into next quarter's margin. That's what KPIs are for. They translate the daily noise of running a clinic into numbers you can actually manage against.
The problem most practices run into isn't a lack of data. It's too much of it, with no sense of which numbers matter, what "good" looks like, or how the categories connect. This guide walks through the financial, operational, clinical, and patient experience metrics worth tracking in 2026, with the actual industry benchmarks behind each one, so you're not guessing at whether your numbers are healthy or a warning sign.
Financial metrics get the most attention for a reason. A clinic can deliver excellent care and still fail if claims aren't clean, collections lag, and denials go unmanaged. These are the numbers revenue cycle teams live and die by.
Clean claim rate measures the percentage of claims that get accepted and paid on the first submission, with no manual correction or resubmission needed.
Formula: (Claims paid on first submission ÷ Total claims submitted) × 100
The Healthcare Financial Management Association generally points to 95–98% as the benchmark range for a financially stable outpatient practice, with top performers reaching 98% or higher. Anything under 90% signals a systemic problem, usually eligibility errors, coding mistakes, or missing prior authorization, and each rejected claim typically adds two to three weeks of delay plus real rework cost once staff time is factored in.
Formula: (Denied claims ÷ Total claims submitted) × 100
Industry averages sit around 8–12%, but best-in-class practices and billing partners keep this under 5%, with anything above 8–10% warranting a root cause review. Denials rarely come from a single source. They tend to cluster around eligibility errors, missing authorizations, coding mismatches, or timely filing misses, and a practice tracking denial rate without a breakdown by reason code is only seeing half the picture.
Days in AR tells you how long it takes, on average, to collect payment after a service is rendered.
Formula: Total AR ÷ Average daily charges
The commonly cited target is 30–40 days, with top-performing practices holding under 25–30. Just as important as the average is the aging distribution: MGMA benchmarking data suggests more than half of total AR should sit in the 0–30 day bucket, with AR older than 90 days ideally staying under roughly 13–14% of the total. Once a claim ages past 120 days, the odds of full collection drop sharply, and many practices start writing balances off around that point.
Formula: (Payments collected ÷ (Total charges − Contractual adjustments)) × 100
A healthy net collection rate runs 95% or higher; anything consistently under 90% points to weak denial follow-up, coding gaps, or breakdowns in patient balance collection. Unlike gross collection rate, net collection rate strips out contractual write-offs, so it reflects how much of the revenue you were actually owed you're keeping. It's one of the clearest single indicators of overall revenue cycle discipline.
This one gets far less attention than it deserves. Cost to collect measures the total expense (staff, software, outsourced billing, postage, clearinghouse fees) required to collect a dollar of revenue, expressed as a percentage of collections.
Formula: Total RCM operating costs ÷ Total collections
Practices running billing fully in-house often land between 4–7% of collections; efficient outsourced RCM arrangements frequently land lower, since claim volume, technology, and specialized staff are shared across a larger book of business. A rising cost-to-collect ratio, even with stable net collections, usually means denials, rework, or staff turnover are quietly draining the department.
With high-deductible health plans now covering a large share of commercially insured patients, patient responsibility has become a meaningful slice of practice revenue rather than an afterthought. Tracking the percentage of patient balances collected at or near the time of service, rather than through statements sent weeks later, has become one of the more actionable financial KPIs a front desk can influence directly.
Operational metrics show whether patient demand is actually converting into delivered, billable care, and whether the administrative machinery behind the visit is running efficiently.
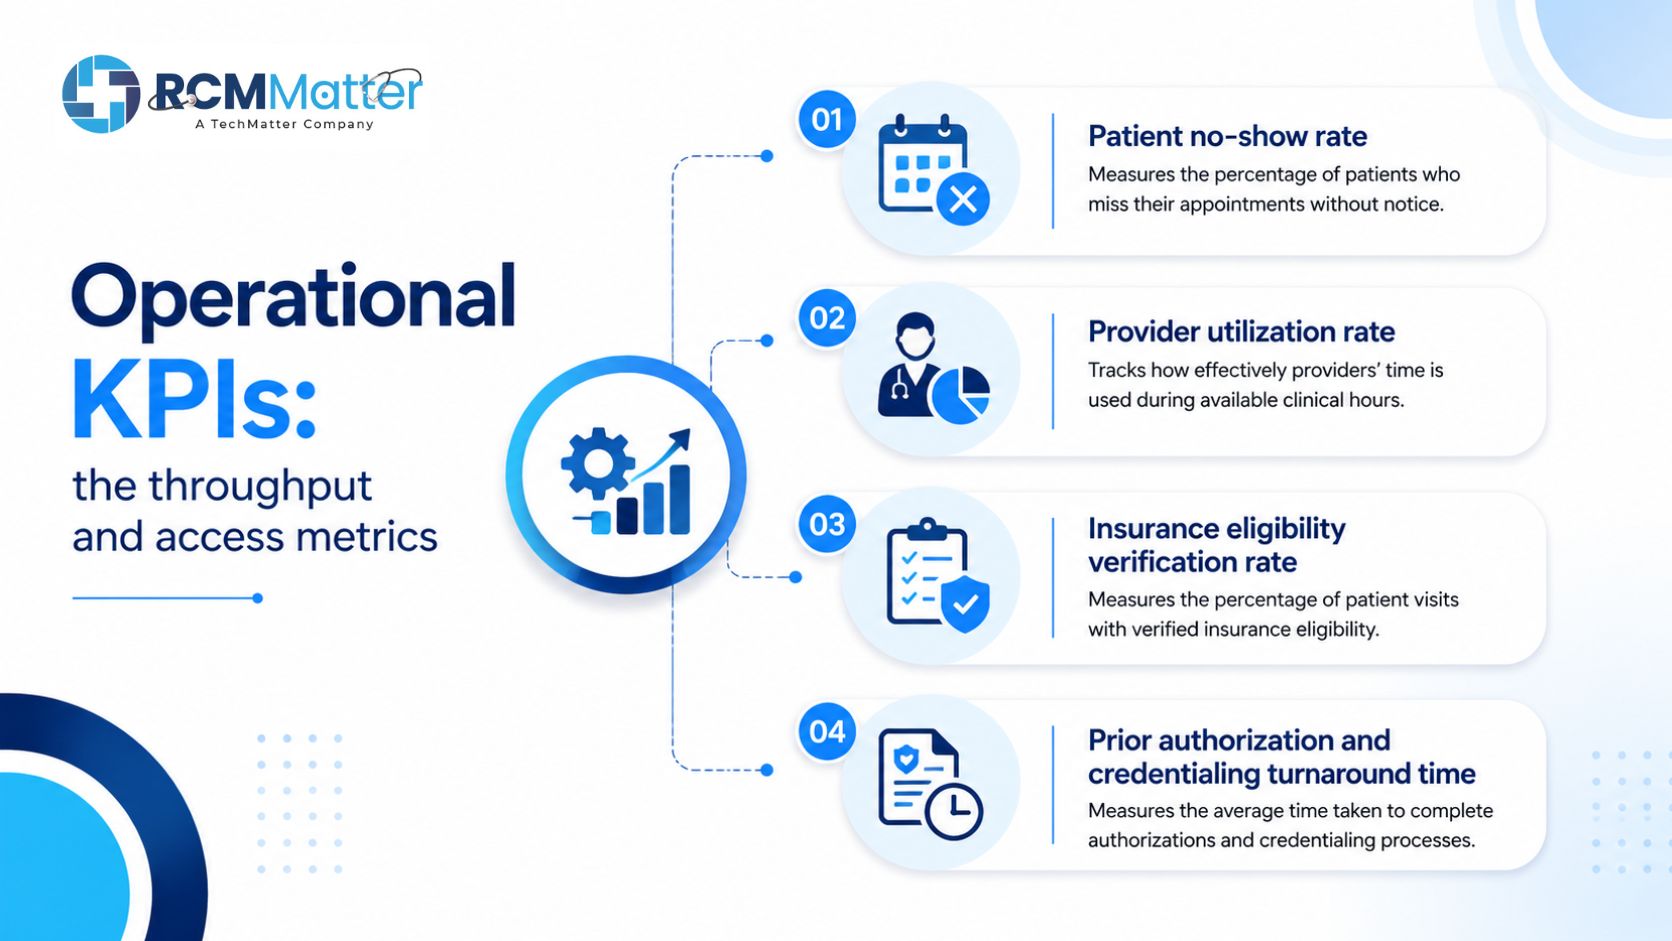
Formula: (No-shows ÷ Total scheduled appointments) × 100
National averages vary widely by specialty and setting, generally landing somewhere between 5% and 20%, with behavioral health and pediatrics often running higher and general primary care running lower. MGMA benchmarking for well-managed practices points to a target range of roughly 5–8%. The financial impact compounds quickly: individual missed appointments are commonly estimated near $150–200 each once lost revenue, wasted staff prep time, and idle room capacity are added up, and a practice running a 10% no-show rate on a moderate patient volume can lose well into six figures a year.
Formula: (Care hours delivered ÷ Total available hours) × 100
A target range of 70–85% balances productivity against burnout risk. Utilization consistently above 90% tends to correlate with higher staff turnover and a rising error rate, which is exactly why this metric should never be reviewed in isolation from denial rate or patient satisfaction.
The percentage of scheduled visits with eligibility and benefits confirmed before the patient arrives is one of the most underrated leading indicators in the entire revenue cycle, because it happens upstream of nearly every downstream denial. Practices with high, consistent verification rates see measurably fewer eligibility-related denials, which is the single most preventable denial category.
Two metrics that rarely appear on generic KPI lists but matter enormously for specialty and procedural practices: average days to secure a prior authorization, and average days to complete provider credentialing and payer enrollment. A slow credentialing cycle doesn't just delay a new provider's start date. It delays every claim tied to that provider until enrollment is complete, which is a direct and often underestimated revenue drag during growth or hiring periods.
Clinical quality metrics have moved from "nice to track" to directly tied to reimbursement under most value-based and quality-incentive payer contracts.
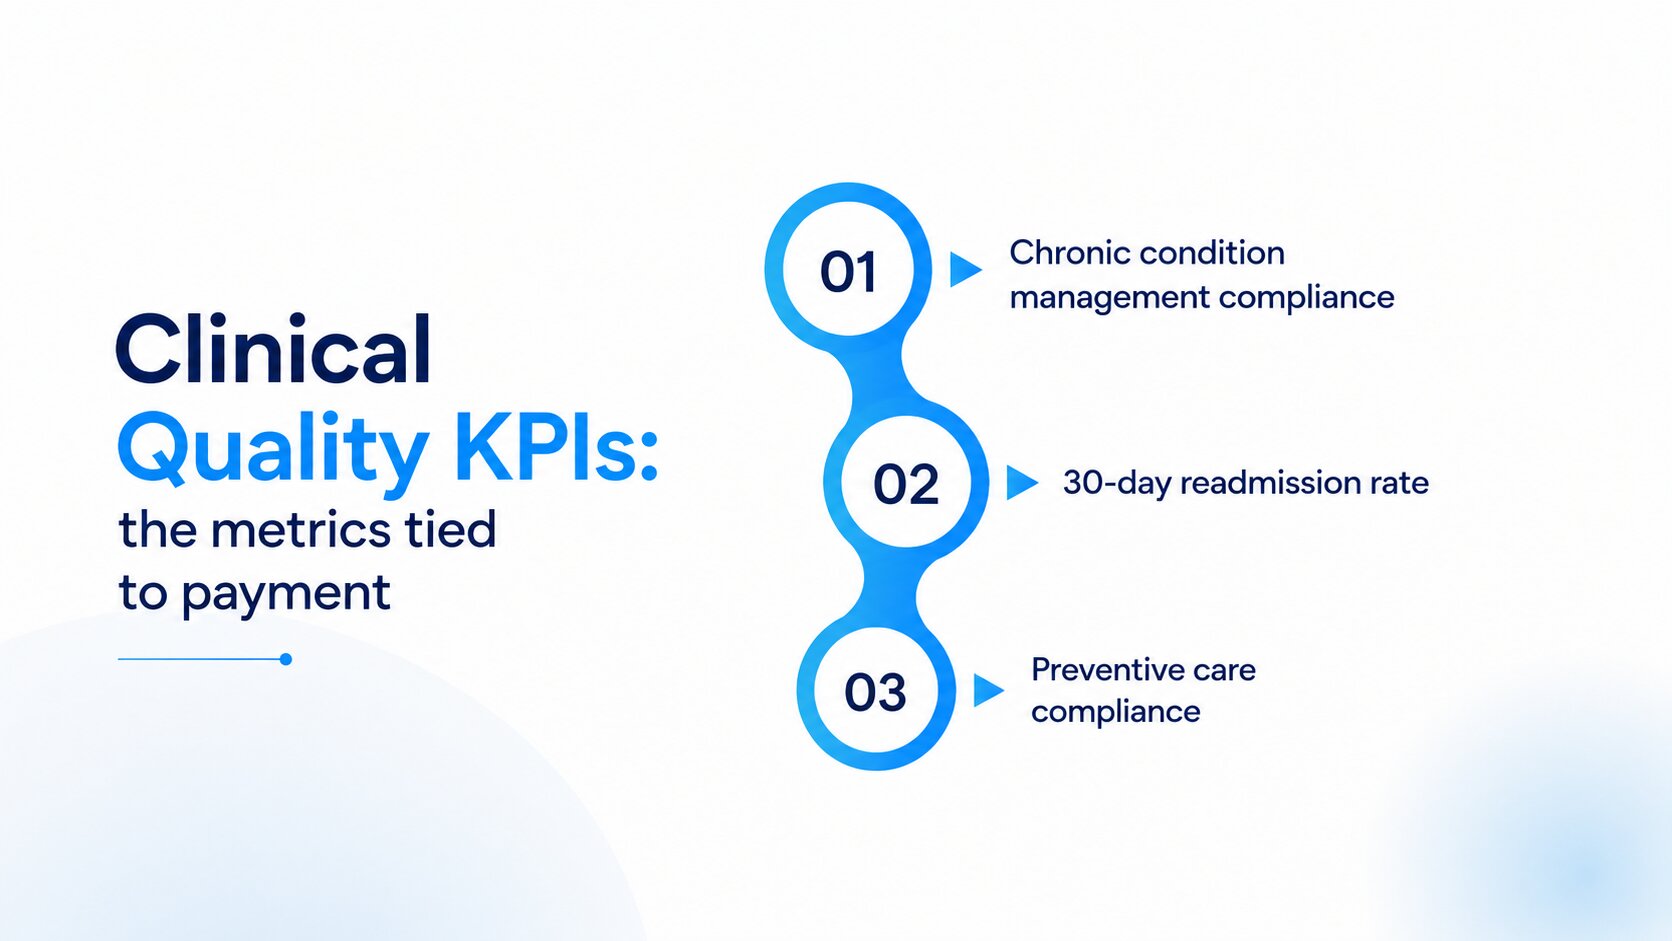
Formula: (Patients meeting care guidelines ÷ Eligible patients) × 100
Leading practices under CMS and commercial payer quality programs typically target 85–90% compliance for measures like HbA1c testing in diabetic populations. A clinic sitting closer to 70–75% still has real financial exposure, since these are frequently tied to quality bonuses or risk-adjustment accuracy.
Formula: (Readmissions ÷ Total discharges) × 100
Rates above roughly 10% generally point to gaps in discharge coordination, medication reconciliation, or post-discharge follow-up scheduling, all of which sit at the intersection of clinical and administrative process.
Screening, vaccination, and wellness visit completion rates don't have one universal target, but the direction matters more than any single number: consistent upward movement here reduces future acute care costs and strengthens performance in nearly every value-based contract.
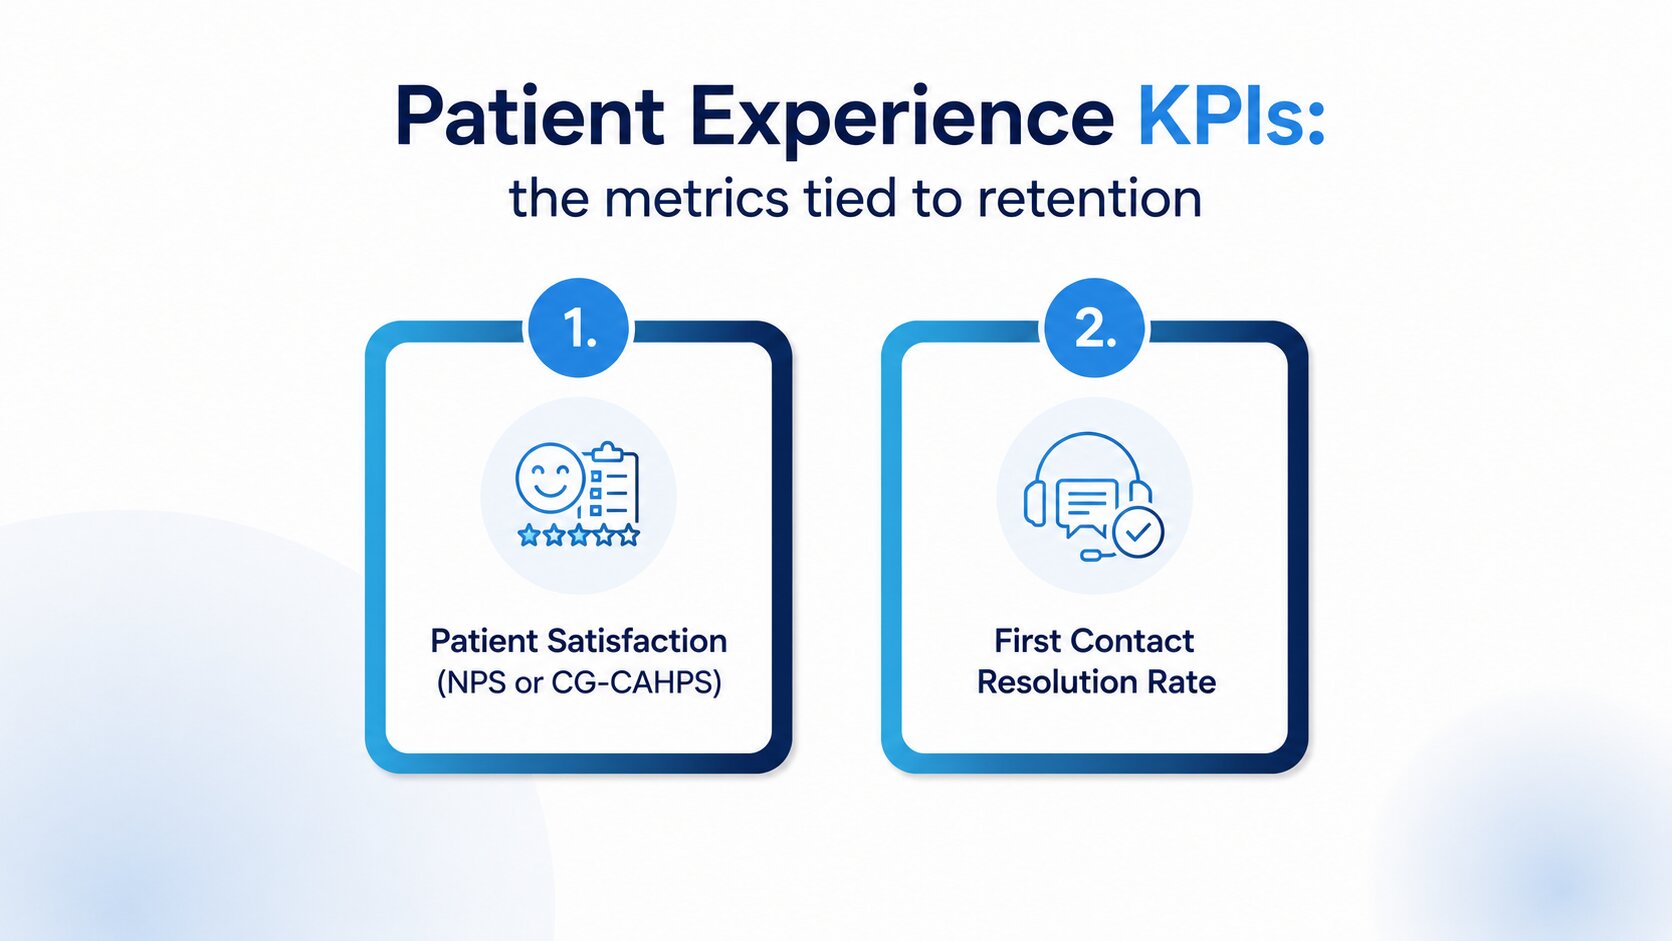
Formula (NPS): % Promoters − % Detractors
A score above roughly 45 signals strong patient advocacy. Below that, it's worth digging into which specific touchpoint, scheduling, wait time, or billing clarity, is driving the gap, since NPS alone doesn't tell you where to intervene.
The share of billing, scheduling, or clinical questions resolved in a single interaction, without a callback or transfer. High-performing clinics and billing teams routinely exceed 80%. This metric matters more than it gets credit for, because unresolved billing questions are one of the more common triggers for a patient balance going to collections instead of getting paid directly.
None of these categories move independently. A slow prior authorization process doesn't just delay care. It shows up later as a denial, then as aging AR, then as a patient satisfaction complaint about a confusing bill. A high no-show rate doesn't just cost same-day revenue. It skews provider utilization numbers and can mask an access problem that's really about wait times, not scheduling.
Reviewing revenue cycle KPIs and clinical or patient experience KPIs side by side, rather than in separate reports built by separate departments, is what turns a stack of dashboards into an actual management tool.
|
Metric | Formula | Healthy Benchmark |
|
Clean Claim Rate | Claims paid on first submission ÷ Total claims × 100 | 95–98%+ |
|
Denial Rate | Denied claims ÷ Total claims submitted × 100 | Under 5–8% |
|
Days in AR | Total AR ÷ Average daily charges | 25–40 days |
|
AR over 90 days | % of total AR aged 90+ days | Under ~13–14% |
|
Net Collection Rate | Payments ÷ (Charges − Contractual adjustments) × 100 | 95%+ |
|
Cost to Collect | Total RCM cost ÷ Total collections | 4–7% (in-house) |
|
Patient No-Show Rate | No-shows ÷ Total scheduled appointments × 100 | 5–8% |
|
Provider Utilization | Care hours ÷ Available hours × 100 | 70–85% |
|
Chronic Care Compliance | Patients meeting guidelines ÷ Eligible patients × 100 | 85–90% |
|
30-Day Readmission Rate | Readmissions ÷ Total discharges × 100 | Under 10% |
|
Patient Satisfaction (NPS) | % Promoters − % Detractors | Above 45 |
|
First Contact Resolution | % resolved in one interaction | Above 80% |
A few commonly tracked numbers deserve less weight than they get:
Tracking fewer, better-defined KPIs consistently outperforms tracking everything inconsistently. A dashboard with forty metrics nobody reviews monthly is worth less than five metrics reviewed every week.
Knowing the benchmark numbers is the easy part. The harder part is building a process around them:
For practices without the internal bandwidth to build and maintain this kind of tracking, that's precisely the gap a dedicated revenue cycle management partner is built to close: clean claim scrubbing before submission, denial tracking by root cause, AR follow-up on a defined cadence, and reporting that ties the financial numbers back to what's happening operationally and clinically. The benchmarks above are the target. Getting there consistently, month over month, is the actual work.
Tracking revenue cycle KPIs is only valuable if you can turn those insights into measurable improvements. RCM Matter helps healthcare providers optimize every stage of the revenue cycle, from medical billing and coding to claim scrubbing, denial management, AR follow-up, payment posting, and financial reporting. Our team works closely with practices to improve clean claim rates, reduce denials, accelerate reimbursements, and maximize revenue without increasing administrative burden.
Whether you're struggling with aging accounts receivable, rising denial rates, or inconsistent collections, our revenue cycle experts can identify the root causes and implement strategies that improve your financial performance.
Request a free revenue cycle assessment today and discover how RCM Matter can help your practice achieve stronger KPIs, healthier cash flow, and long-term financial success.
Optimize billing, claims and collections with expert RCM support let our professionals handle the process so you can focus on patient care.